This is an old revision of the document!
6. Sequential Logic
“I Know What You Did Last Cycle”
6.1 State Diagram, State Transition Diagram
6.1.1 Motivation
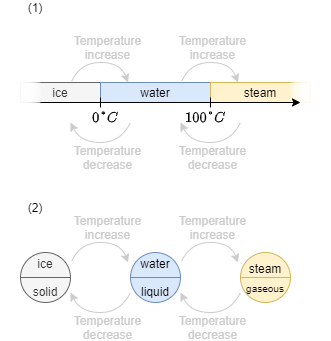
The diagrams of different states are well known from physics for example the state diagram (or better: phase diagram) of water, where its three states are: solid ice, liquid water and gaseous steam. The possible state transitions are due to temperature increase or decrease.
In figure 9 image (1) the states of water are shown on the temperature axis. When only the state transistions are relevant, the states are simplified to a circle, showing the state name and behaviour. The transitions are depict as arrows, where the needed condititon is written onto (See figure 9 image (2) ). This diagram is called state transition diagram.
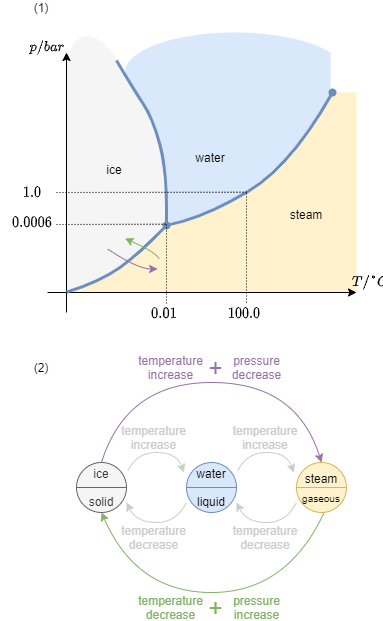
For matter not only the dimension “temperature” is important, but also the “pressure”. The full phase diagram is shown in figure 10 image (1). By this, another variable is available and more transistions. These can be drawn into the state transition diagram (figure 10 image (2)).