This is an old revision of the document!
6. Sequential Logic
“I Know What You Did Last Cycle”
6.1 State Diagram, State Transition Diagram
6.1.1 Motivation
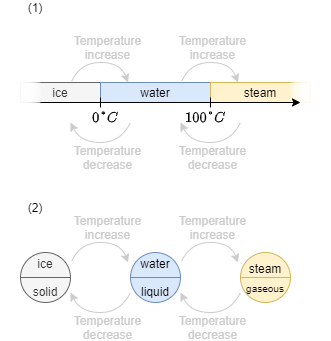
The diagrams of different states are well known from physics for example the state diagram (or better: phase diagram) of water, where its three states are: solid ice, liquid water and gaseous steam. The possible state transitions are due to temperature increase or decrease.
In figure 9 image (1) the states of water are shown on the temperature axis. When only the state transistions are relevant, the states are simplified to a circle, showing the state name and behaviour. The transitions are depict as arrows, where the needed condititon is written onto (See figure 9 image (2) ). This diagram is called state transition diagram.
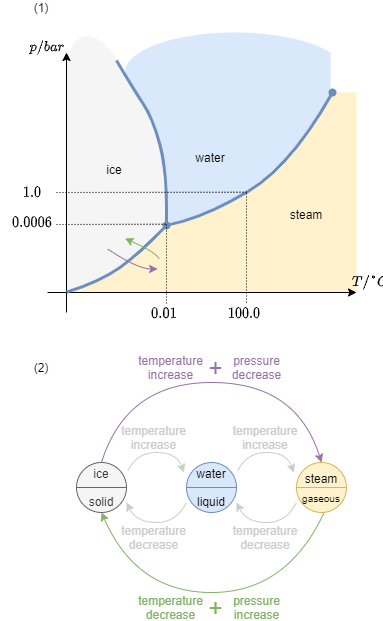
For matter not only the dimension “temperature” is important, but also the “pressure”. The full phase diagram is shown in figure 10 image (1). By this, another variable is available and more transistions. These can be drawn into the state transition diagram (figure 10 image (2)).
6.1.2 Simple logic Example
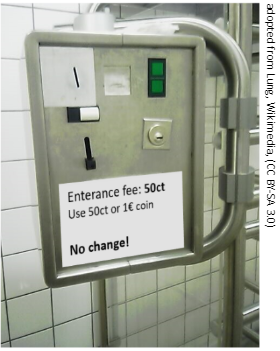
In German, often one has to pay for entering the toilet. An example of such a entrance control system is shown in figure 11. At this (artificial) example, one can pay either 50ct or 1€.
Once paid, the turnstile will release and one can enter. Once the turnstile was pushed the entrance is closed again.
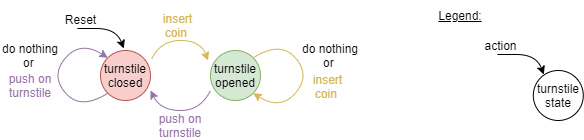
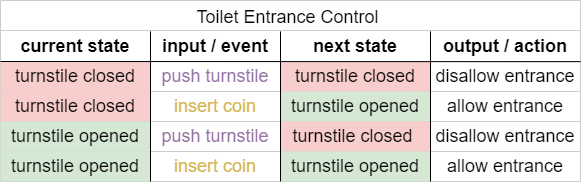
The figure 12 the state transition diagram is drawn.
- The two states are that (1) the turnstile is opened and one is able to go through and (2) the turnstile is closed and one cannot enter anymore.
- The transitions are given by the done actions: one can either insert a coin or push on the turnstile.
Important here are some additional considerations:
- For the state transition diagram one has to look for all possible transitions. So, also pushing a closed turnstile or inserting more coins have to taken into account.
- A state transition diagram is not complete without a legend and without an beginning/reset point. The reset point is given by an arrow with “reset” written onto it
Out of this state transition diagram one can create a table-like representation, see figure 13.
the inputs, outputs and states have to be encoded into binary, in order to investigate this table a bit more. How the binary value is connected to the outputs does not matter. We will choose the following coding:
- Encoding of the states: turnstile closed ≙ $Q=0$, turnstile opened ≙ $Q=1$,
- Encoding of the inputs: no coin inserted ≙ $Xc=0$, coin inserted ≙ $Xc=1$, turnstile not pushed ≙ $Xp=0$, turnstile pushed ≙ $Xp=1$,
- Encoding of the outputs: disallow entrance ≙ $Y=0$, allow entrance ≙ $Y=1$,
This table is shown in figure 1 and is called state transition table.
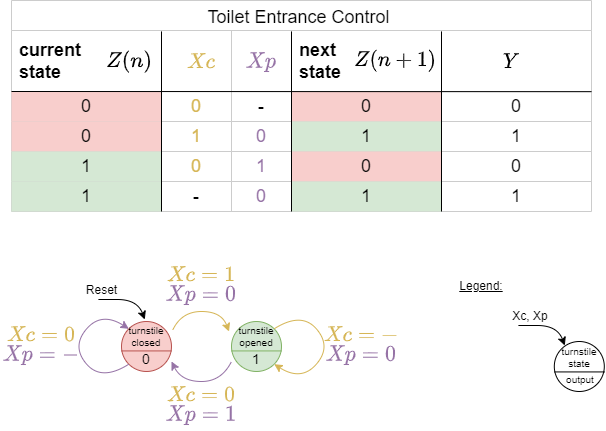
Interestingly, the logic circuit for this state transition table was already part of the course: it is the RS flip-flop! When looking deeper onto the table in figure 1 one can substitute $Xc$ with $S$ (as in Set) and $Xp$ with $R$ (as in Reset) to directly get the truthtable of the RS flip flop.