Lab03 - AC Technology, Rectification (Capacitors, Diodes)
You have an electric vehicle and want to charge the battery from an AC grid voltage. An on-board charger (OBC) of an electric vehicle converts AC grid voltage into DC voltage to charge the high-voltage battery.
Operating Principle:
AC Input
- The grid provides a sinusoidal AC voltage that alternates between positive and negative values.
Rectification (Full-Bridge)
- A full-bridge rectifier uses four diodes. During each half-cycle, two diodes conduct, ensuring that current always flows in the same direction through the load.
Pulsating DC Output
- The output voltage is always positive but contains significant ripple at twice the grid frequency (100 Hz).
Smoothing
- A capacitor connected in parallel to the load reduces voltage ripple by storing and releasing energy.
Active Rectification (PFC)
- In real EV chargers, active rectifiers improve efficiency and power factor by shaping the input current to follow the voltage waveform.
Voltage Divider and Bridge Circuit
Background Information
In earlier experiments, various circuits were built. Specifically, the voltage divider (left), the simple diode circuit with series resistor (middle), and a capacitor circuit with series resistor (right) were already described, s. figure 1. In principle, the last two circuits and many more can also be understood as voltage dividers. For this reason, the voltage divider is a central circuit in electrical engineering and is often called a half-bridge.

Both half-bridge and full-bridge are used for rectification in this experiment.
The Half-Wave Rectifier
Background Information
In a half-wave rectifier, only one half-wave of the AC voltage is rectified; the other half-wave is not used. Such a rectifier consists only of a single diode.
During the half-period in which the diode is operated in forward direction, a voltage is built up at the output (s. figure 2). In the second half-period, the diode is operated in reverse direction. If the diode is operated in reverse direction, no current can flow because the diode does not become conductive. As a result, no current can flow through the resistor. Thus, the entire negative voltage of the second half-wave lies across the diode and not across the resistor.
Disadvantages of half-wave rectification are the comparatively large ripple on the DC side and the poor efficiency. In addition, the upstream transformer becomes magnetized because it is only traversed by current in one direction.

Experimental Tasks
- Build the half-wave rectifier circuit shown in figure 3 with the diode and the load resistor. Take the transformer output voltage $u_{\rm Sec}$ from the variable low-voltage terminals (L1 and N at your table). The voltages $u_{\rm Sec}$ and $u_{\rm R}$ are to be measured with the oscilloscope. Draw the connection between the circuit and the oscilloscope in figure 3.

- Sketch the oscilloscope display with the voltages $u_{\rm Sec}$ and $u_{\rm R}$ in the screen image figure ##.
- Switch now a capacitor (electrolytic capacitor) with 100 µF in parallel to the resistor $R_{\rm L}$ and sketch the voltage curve of $u_{\rm Sec}$ and $u_{\rm R}$ again.
Warning: When using an electrolytic capacitor, observe the correct polarity!

Fig. 5 Channel 1: $ \frac{V}{\rm DIV} = $
Channel 2: $ \frac{V}{\rm DIV} = $
Time basis: $ \frac{T}{\rm DIV} = $
- Measure the following values with the help of the oscilloscope and enter the results in table 1 (C = 100 µF):
- Secondary-side voltage of the transformer $û_{\rm Sec}$
- Frequency of the secondary transformer voltage $f_{\rm Sec}$
- Peak-to-peak ripple voltage $u_{\rm PP-ripple}$
- Ripple frequency $f_{\rm Ripple}$
- Average value of the rectified voltage $|ū_{\rm R}|$
- Peak value of the rectified voltage $u_{\rm R,~max}$


- Carry out the corresponding measurements – as above – again on the half-wave rectifier. These were the secondary-side voltage of the transformer $û_{\rm Sec}$, the frequency of the secondary transformer voltage $f_{\rm Sec}$, the peak-to-peak value of the ripple voltage $u_{\rm PP-ripple}$, the ripple frequency $f_{\rm Ripple}$, the average value of the rectified voltage $|ū_{\rm R}|$ and the peak value of the rectified voltage $u_{\rm R,~max}$. Enter the results in the second free line of table 1.
Test questions - Half-Wave Rectifier
Bridge Rectifier
Background information
Another central circuit can be created by placing two half-bridges in series and connecting both through a bridge branch. In this way, one obtains the full bridge or H-bridge (s. figure 7).

From the H-bridge, many different circuits can be derived. figure 7 left shows the Wheatstone measuring bridge, in which the resistor $R_{\rm L}$ can be determined using a potentiometer $R_{\rm 2}$ and a voltmeter. In the right image, the switching full bridge is shown, which can, for example, drive a motor. The middle image shows the bridge rectifier, which will be described in more detail later.
Always pay attention in full-bridge circuits to where the input and output voltages are located.
Experimental Tasks
In figure 8 the circuit of a bridge rectifier is shown.
- Enter the current arrows correctly.
- Draw the connection between the oscilloscope and the circuit in order to measure the output voltage $u_{\rm R}$ at the rectifier.
- Explain why one cannot measure the secondary voltage of the transformer and the output voltage of the bridge rectifier at the same time.
${\rm ................................................................................................}$
${\rm ................................................................................................}$
${\rm ................................................................................................}$

- Build the circuit and connect the oscilloscope.
- Sketch the voltage curve before and after the bridge rectifier, i.e. the voltages $u_{rm Sec}$ and $u_{\rm R}$. However, note that you connect the ground of the oscilloscope before or after the bridge rectifier for the respective measurement.
- Connect a capacitor (electrolytic capacitor) with 100 µF in parallel to the resistor $R_{\rm L}$ and sketch the voltage curve of $u_{rm Sec}$ and $u_{\rm R}$ again in figure 9 with a different color.
Warning: When using an electrolytic capacitor (Elko) the correct polarity must be observed!
- Measure the following values with the help of the oscilloscope in the circuit and enter the results into table 2 (100 µF):

- Consider a measure by which the ripple voltage can be reduced.
- Draw the circuit with your found solution into figure 10 and measure the voltage curves $u_{rm Sec}$ and $u_{\rm R}$.
- Enter these into the screen image figure ## with a third color.

Fig. 10
- Carry out the corresponding measurements – as above – again on the bridge rectifier. These were the secondary-side voltage of the transformer $û_{\rm Sec}$, the frequency of the secondary transformer voltage $f_{\rm Sec}$, the peak-to-peak value of the ripple voltage $u_{\rm PP-ripple}$, the ripple frequency $f_{\rm Ripple}$, the average value of the rectified voltage $|ū_{\rm R}|$ and the peak value of the rectified voltage $u_{\rm R,~max}$.
- Enter the results in the second free line of table 2.
Test questions - Bridge Rectifier
Fixed Voltage Regulator
Background information
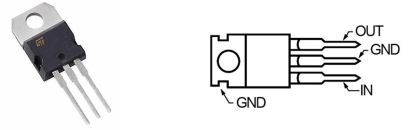
Experimental Tasks
Through the use of a fixed voltage regulator, a regulated DC voltage of 5 V shall now be generated.
- Draw the corresponding circuit with transformer, bridge rectifier, capacitor, fixed voltage regulator 7805 and resistor into figure 12.

Fig. 13 Channel 1: $ \frac{V}{\rm DIV} = $
Channel 2: $ \frac{V}{\rm DIV} = $
Time basis: $ \frac{T}{\rm DIV} = $
- Now compare the measured values of the half-wave rectifier circuit with the values of the bridge circuit and document your findings in a few short sentences (advantages, disadvantages).
${\rm ................................................................................................}$
${\rm ................................................................................................}$
${\rm ................................................................................................}$
${\rm ................................................................................................}$
${\rm ................................................................................................}$
${\rm ................................................................................................}$
- What additional advantage does the fixed voltage regulator provide with regard to the peak-to-peak value of the ripple voltage and the ripple frequency?

${\rm ................................................................................................}$
${\rm ................................................................................................}$
${\rm ................................................................................................}$
${\rm ................................................................................................}$
Test questions - Fixed Voltage Regulator
Three-phase AC
Background information
In a DC network or an AC network with only two live conductors, only a single voltage is available at the end of the line. In contrast, in a three-phase AC network (three-phase current) with the external conductors L1, L2, L3 and the neutral conductor N, the possibility arises to connect to two different voltage levels. The three external conductors can be used individually or together with the neutral conductor to supply electrical loads. This enables the economic supply of consumers with greatly differing power consumption on the same network.
The generator circuit diagram is shown in figure 14.

At the control panel of your laboratory workstation there are sockets. The designations of the sockets are: L1, L2, L3 and N. Connect these sockets to your breadboard.
Warning: There is a risk of short circuit!
Experimental Tasks
- Sketch the voltages $U_{\rm 1}$, $U_{\rm 2}$ and $U_{\rm 3}$ using the oscilloscope.
- Enter all three line-to-neutral voltages into a single screen image and use a different color for each external conductor.
- Also label the waveforms with the corresponding voltages. To do this, measure $U_{\rm 1}$ and $U_{\rm 2}$ as well as $U_{\rm 1}$ and $U_{\rm 3}$ simultaneously.
- Draw the phasor diagram of the voltages $U_{\rm L1-N}$, $U_{\rm L2-N}$ and $U_{\rm L3-N}$.
- Complete your phasor diagram with the line-to-line voltages $U_{\rm L1-L2}$, $U_{\rm L2-L3}$ and $U_{\rm L3-L1}$.
- How large are these voltages?

The Three-Phase Midpoint Circuit
Background information
The circuit shown in figure 17 is a three-phase midpoint circuit.
Experimental Tasks
- Enter into the three-phase midpoint circuit, s. figure 17, the rectified voltage and the current. Now connect the oscilloscope to the built circuit so that the output voltage at the rectifier can be displayed together with $U_{\rm 1}$ or $U_{\rm 2}$ or $U_{\rm 3}$. Label the waveforms with the corresponding voltages.
- Draw the oscilloscope screen image in another color into the diagram <Fig-15_V4-Screen-image>.
- Which maximum and minimum values of the rectified voltage occur?
${\rm ................................................................................................}$
- What is the average value of the rectified voltage?
${\rm ................................................................................................}$
- How large is the ripple frequency?

${\rm ................................................................................................}$
The Three-Phase Bridge Rectifier Circuit
Build the three-phase bridge rectifier circuit shown in figure 18
- Connect the oscilloscope so that the voltage after the three-phase bridge can be measured.
- Sketch the oscilloscope screen image, s. figure ##
- Label the waveforms with the corresponding voltages.

- Which maximum and minimum values of the rectified voltage occur?
${\rm ................................................................................................}$
- What is the average value of the rectified voltage?
${\rm ................................................................................................}$
- How large is the ripple frequency?
${\rm ................................................................................................}$
- Now connect a capacitor (electrolytic capacitor) with 100 µF in parallel to the load resistor and sketch the oscilloscope screen image, s. figure ##.
- Label the waveforms with the corresponding voltages.
- Give the oscilloscope settings used:
${\rm ................................................................................................}$
Warning: When using an electrolytic capacitor (Elko) the correct polarity must be observed!
Fig. 20 Channel 1: $ \frac{V}{\rm DIV} = $
Time basis: $ \frac{T}{\rm DIV} = $
- Which maximum and minimum values of the rectified voltage occur?
${\rm ................................................................................................}$
- What is the average value of the rectified voltage?
${\rm ................................................................................................}$
- How large is the ripple frequency?
${\rm ................................................................................................}$
- Compare all measured circuits and explain the advantages and disadvantages of each circuit.
- Name one application for each circuit.
${\rm ................................................................................................}$
${\rm ................................................................................................}$
${\rm ................................................................................................}$
${\rm ................................................................................................}$
${\rm ................................................................................................}$
${\rm ................................................................................................}$
Test questions - Three-phase AC